Explaining 10yr-2yr Spread and Fed’s Meeting Baseline Scenario. Near Term USD Outlook

Decline of US Dollar accelerated on Wednesday before the Fed meeting as the consensus strengthened that the US Central Bank will float additional monetary easing measures today. On Monday we discussed the possible forms of this easing - an increase in the duration of the Treasury portfolio, or an outright increase in QE (which is less likely). QE is when the central bank tries to adjust basic risk-free market rates - government bond yields, through guaranteed monthly asset purchases of some volume. By adjusting risk-free rates, the Fed expects other interest rates (including lending rates) to adjust as well. An increase in portfolio duration is when the central bank decides to buy more long-term bonds than short-term bonds in order to lower the long-term borrowing costs.
The need to increase purchases of long-term bonds can be seen from the following chart:
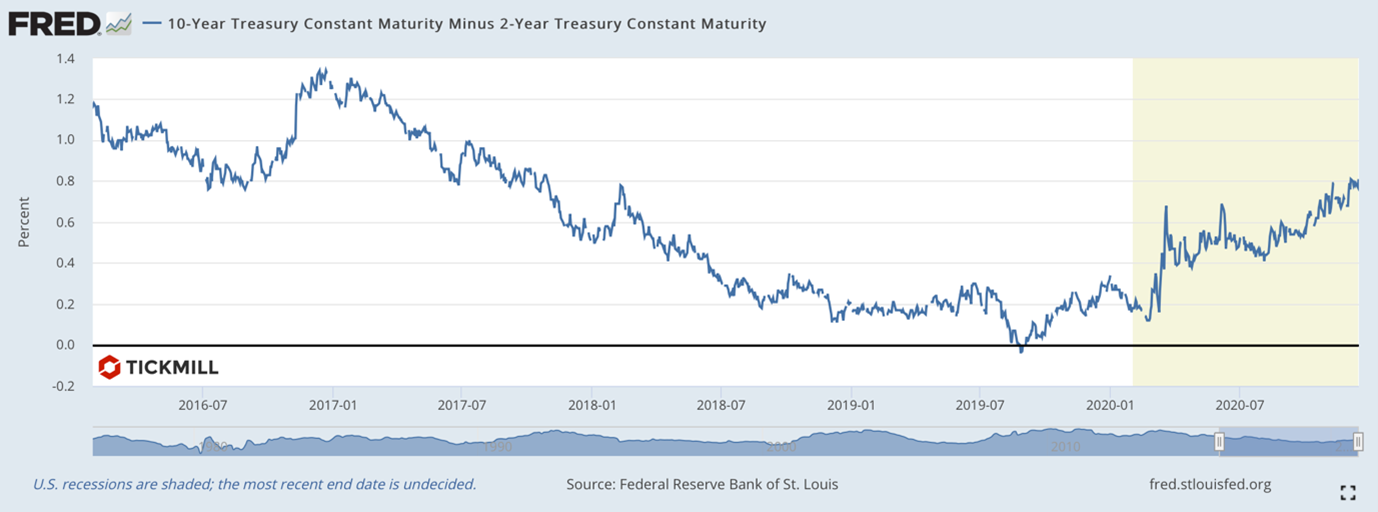
This "somewhat forgotten" chart of the spread between 10-year and 2-year Treasury yields is a well-known "harbinger" of recessions and booms. Recall that from the summer of 2019 this chart was a popular “workhorse” for gloomy forecasts of some market doomsayers. When the spread is at its minimum, the market, roughly speaking, expects stagnation or recession, and vice versa, when the spread grows, it expects a rise. Surprisingly, the market was not wrong about the latest recession, despite its completely non-obvious and sudden origin.
The chart now shows that the demand of long government bonds relatively bonds with shorter maturity is rapidly declining. In other words, the near-term outlook for a return on capital looks more promising than the long-term one. At least that's what the market thinks. Because of this, long-term rates rise as the market demands ever higher returns in order to invest in a “less promising”, long period of time. The Fed may intervene today if it considers that such an increase in long-term rates is not good for long-term borrowers and will slow down the economic recovery. An increase in QE for this purpose looks like overkill, therefore, changes in the composition of purchases within the current volume are more likely - which is what the US stock market and US Dollar are trying to price in.
Short-term USD technical setup:
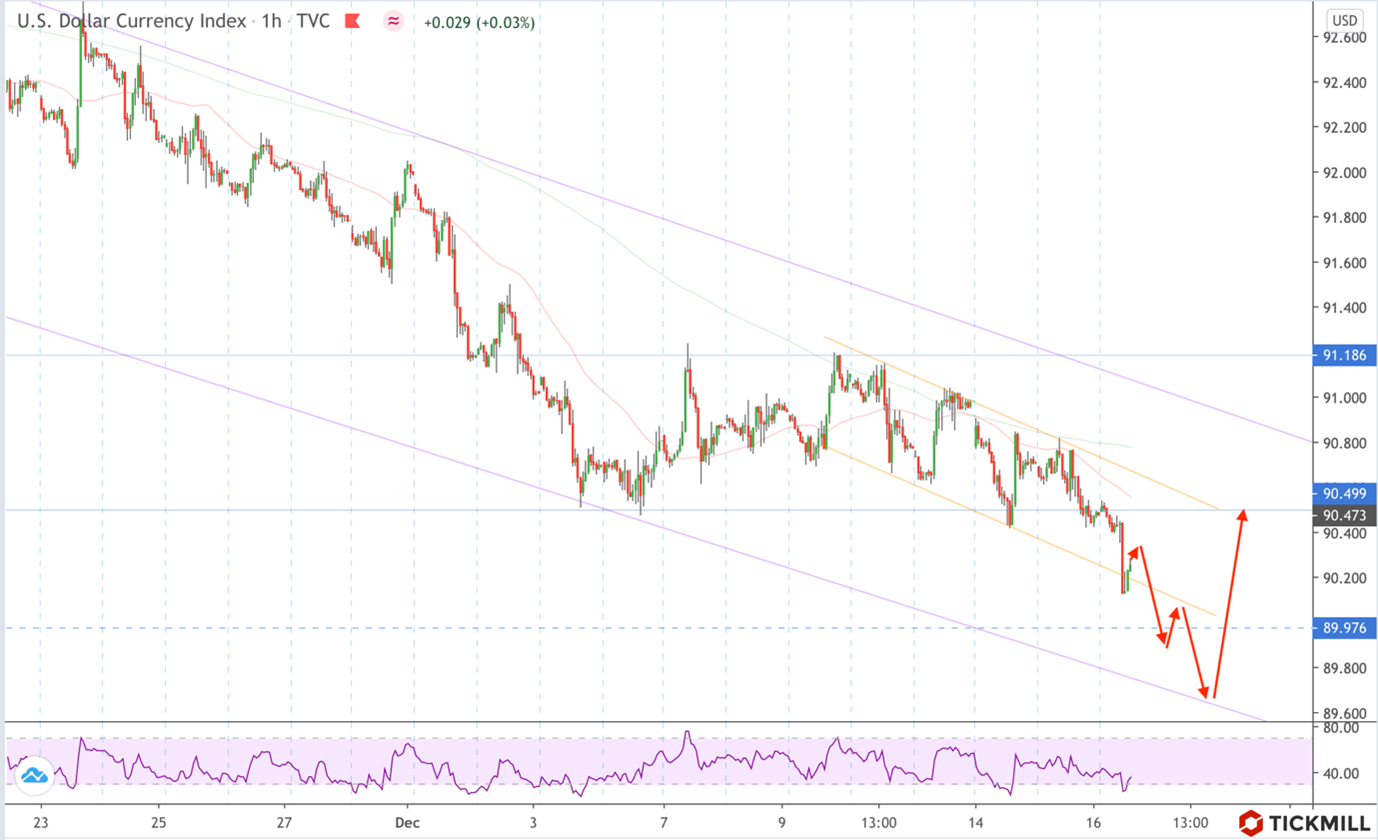
As for the dollar index, several attempts to break the key 90.50 support ended with a breakout of the range (90.50-91.10), which, in my opinion, is a clear signal of resumption of downside pressure. At the same time, the downward movement today brought the price beyond the short-term descending channel, which sets the stage for a test of the channel's lower border on a higher timeframe (89.75) and only then a somewhat significant correction (to 90.50).
Disclaimer: The material provided is for information purposes only and should not be considered as investment advice. The views, information, or opinions expressed in the text belong solely to the author, and not to the author’s employer, organization, committee or other group or individual or company.
High Risk Warning: CFDs are complex instruments and come with a high risk of losing money rapidly due to leverage. 75% and 72% of retail investor accounts lose money when trading CFDs with Tickmill UK Ltd and Tickmill Europe Ltd respectively. You should consider whether you understand how CFDs work and whether you can afford to take the high risk of losing your money.
Disclaimer: The material provided is for information purposes only and should not be considered as investment advice. The views, information, or opinions expressed in the text belong solely to the author, and not to the author’s employer, organization, committee or other group or individual or company.
Past performance is not indicative of future results.
High Risk Warning: CFDs are complex instruments and come with a high risk of losing money rapidly due to leverage. 71% and 74% of retail investor accounts lose money when trading CFDs with Tickmill UK Ltd and Tickmill Europe Ltd respectively. You should consider whether you understand how CFDs work and whether you can afford to take the high risk of losing your money.
Futures and Options: Trading futures and options on margin carries a high degree of risk and may result in losses exceeding your initial investment. These products are not suitable for all investors. Ensure you fully understand the risks and take appropriate care to manage your risk.